Voices of Intermodal Europe 2025
After a week of booth talks and hallway chats at Intermodal Europe 2025, we’ve distilled the key takeaways. This summary captures the…
Lennart Schlüter
Stay informed with expert insights on shipping containers, market trends, pricing guides, and industry best practices. Your trusted resource for container trading knowledge.
How does the Strait of Hormuz crisis affect your container supply? Expert analysis on freight rates, BoL risks, and why SOC containers are now essential.
After a week of booth talks and hallway chats at Intermodal Europe 2025, we’ve distilled the key takeaways. This summary captures the…
Meet us at Intermodal Europe, Barcelona — Booth J20We’ll be on the floor all week at Intermodal Europe (Barcelona) at Booth J20,…
Quick view (Q3 so far): U.S. imports: July jumped to 2.62m TEU (+18.2% vs. June) on tariff front-loading; August eased to ~2.5m…
Automating the SOC container booking process can reduce manual effort, save time, reduce costs, and ultimately streamline logistical operations. This blog will give you…
Whether you’re looking to buy, sell, or rent a shipping container, understanding the different shipping container types will help you to make…
If you’re looking to sell shipping containers, you’ve come to the right place. Read this blog to find out how you can…
![A complete guide for used 40ft shipping container [2025]](/_next/image?url=%2Fblog%2Fused-40ft-shipping-container-featured.jpg&w=1920&q=75)
A 40ft used shipping container is a versatile and cost-effective solution for your business needs. Learn about this container type and how…
![Used 20ft shipping container: Top benefits & uses [+ Prices ‘25]](/_next/image?url=%2Fblog%2Fused-20ft-shipping-container-featured.jpg&w=1920&q=75)
A used 20ft shipping container is a practical and cost-effective alternative to a brand new unit. In this blog, find out all…
Shipping container cost varies from $500 to $5,000. Read on to learn how much you should spend on different types and sizes…
![How many pallets fit in a container: 20ft & 40ft [+find containers at best prices]](/_next/image?url=%2Fblog%2Fhow-many-pallets-fit-in-a-container-featured.jpg&w=1920&q=75)
Pallets provide a stable platform for transporting cargo. This blog explains how many pallets fit in a container and offers 5 tips…
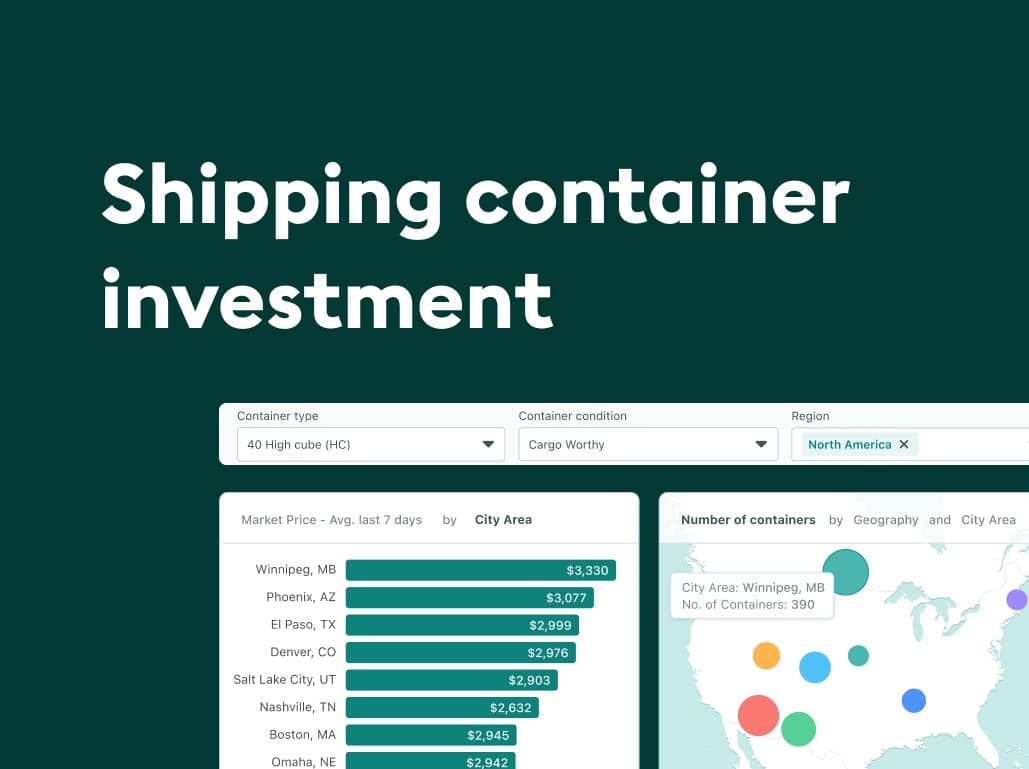
Considering a shipping container investment? This blog is your go-to resource for investing in this versatile asset. Read on to learn how…
Shipping container stores offer a cost-effective and unique alternative to traditional shops. Find out the uses of container shops, get new ideas,…
![Shipping container cafe: Benefits & popular ideas [+how to find containers for cafes]](/_next/image?url=%2Fblog%2Fshipping-container-cafe-featured.jpg&w=1920&q=75)
A shipping container cafe is unique and provides a great alternative to traditional structures. Read this blog to learn about popular cafe…
![Shipping container bar: Top ideas for conversion [+Buy containers at the best prices ‘24]](/_next/image?url=%2Fblog%2Fshipping-container-bar-featured.jpg&w=1920&q=75)
If you’re building a bar, opting for a shipping container over a traditional bricks and mortar structure can save you heaps of…
Browse our inventory, get expert guidance, or manage your purchases independently through our buyer portal.
Explore thousands of shipping containers available for sale or lease across North America with transparent pricing.
Get personalized support, volume quotes, and end-to-end transaction assistance from your dedicated broker.
Get instant access to our full inventory hub, real-time pricing, and manage all your purchases in one place.
Speak with our team
10,000+
Containers Available
50+
Depot Locations
1,000+
Trusted Buyers